
Helm Bank USA
Helm Bank USA 

Purchasing Real Estate Q1 2021
Q1-2021 Miami Beach/Barrier Island, FL Sales
Overview Miami Coastal Mainland
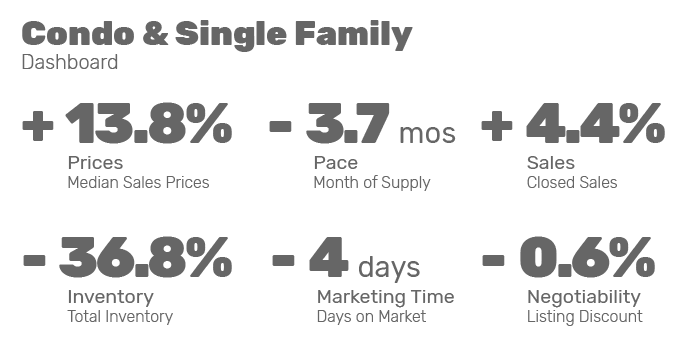
Condo & Single Family
Dashboard
Year-over-Year
Graphs
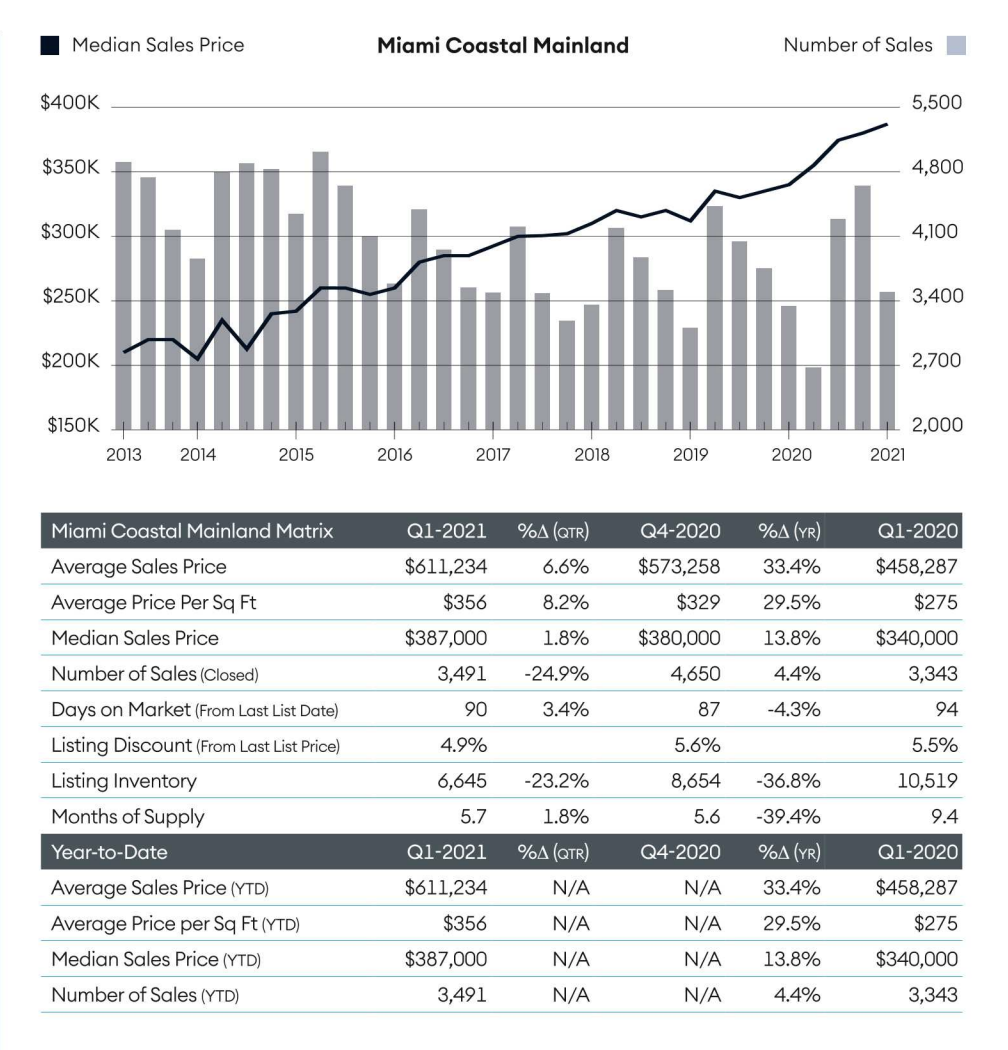
Miami Coastal Mainland
Condo
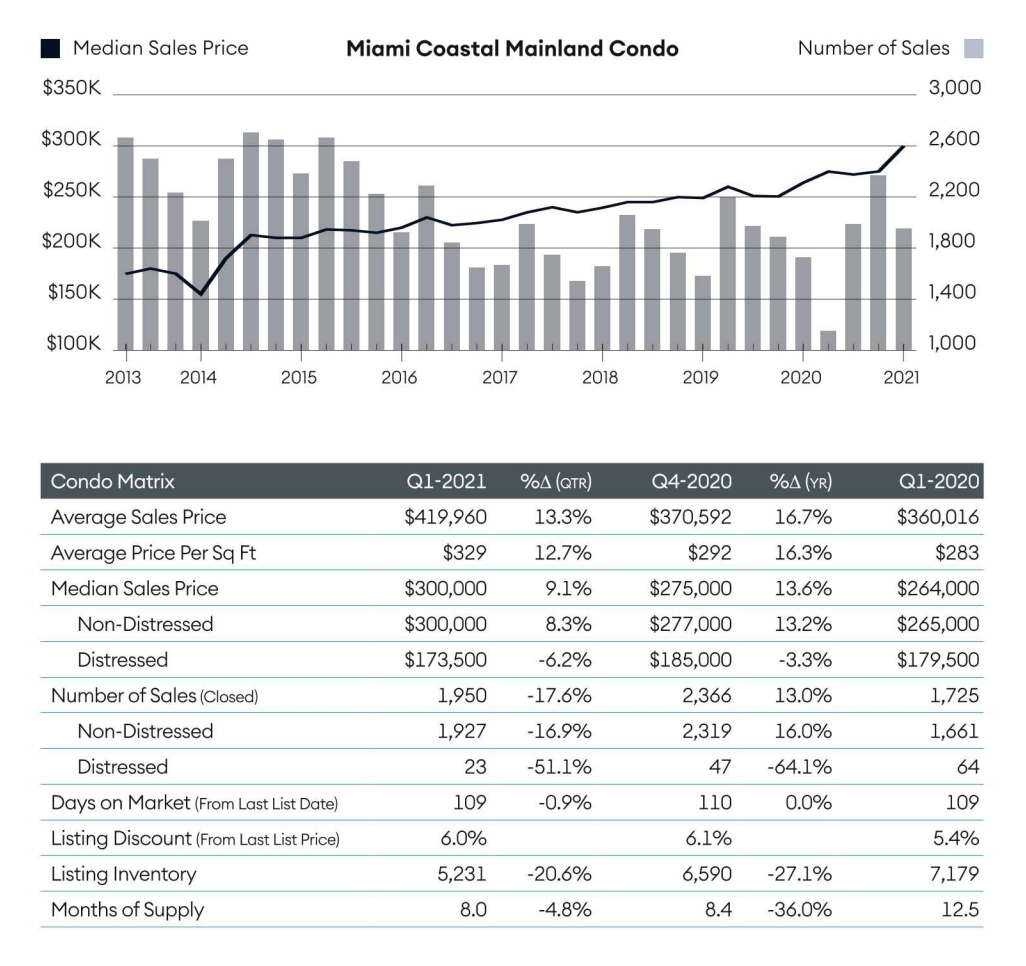
Insights
- Listing inventory fell annually for the seventh consecutive quarter.
- All price trend indicators rose annually, setting new records.
- The number of sales posted large gains year over year for the third straight quarter.
- The second highest market share of non-sales in at least eight years.
Miami Coastal Mainland
Single Family
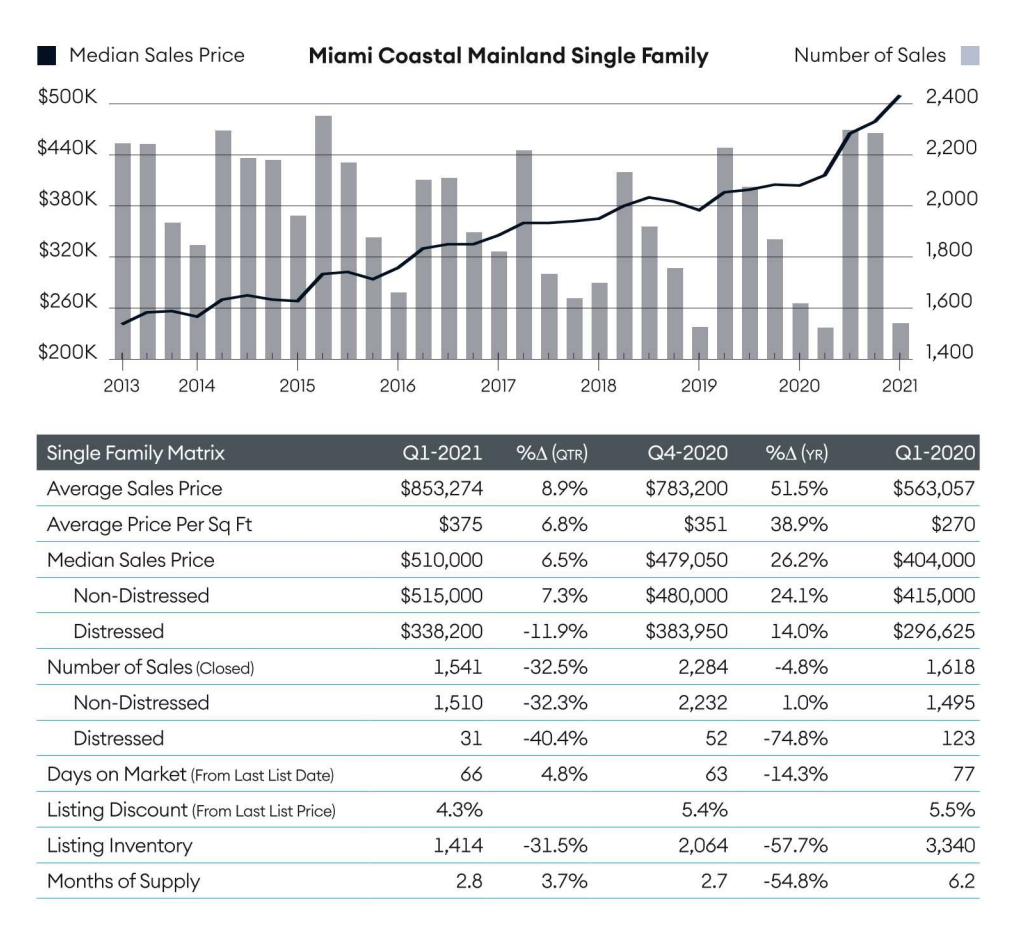
Insights
- All three price trend indicators reached new records for the fourth consecutive quarter.
- Listing inventory fell annually at its fastest rate to a new low.
- The market moved at the second-fastest pace in eight years.
- Average sales size increased year over year at the fastest rate in more than seven years.

Q4-2020 Miami Beach/Barrier Island, Fl Sales
learn more
Condo Matrix by Neighborhood
Aventura
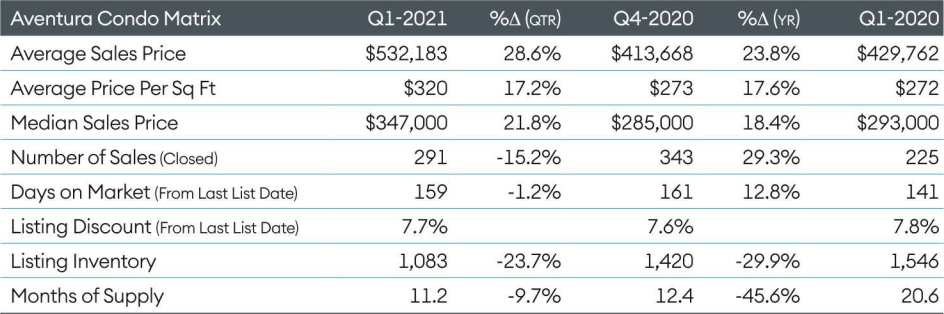
Insights
- All price trend indicators surged year over year to new records.
- The number of sales jumped annually for the third consecutive quarter.
Brickell
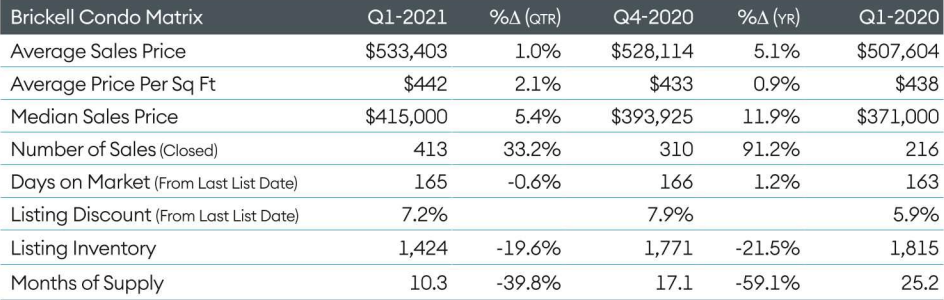
Insights
- Median sales price posted year over year record gains.
- The number of sales nearly doubled year over year at a record rate.
Coconut Grove
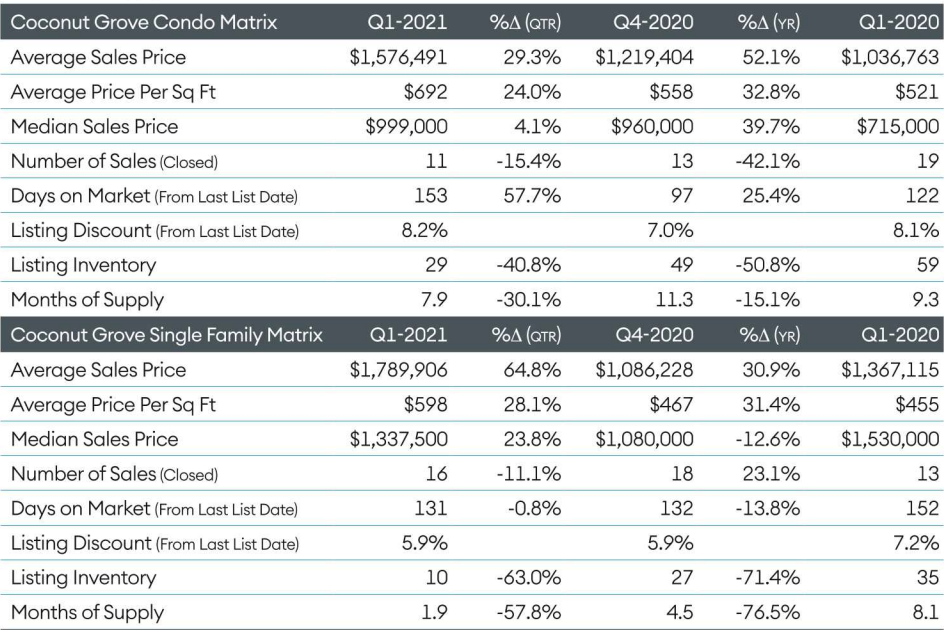
Insights
- Condo price trend indicators surged to new records.
- Condo listing inventory declined year over year to a new low.
- Single family price trend indicators continued to show year over year mixed results.
- Single family listing inventory and months of supply fell sharply to record lows
Downtown
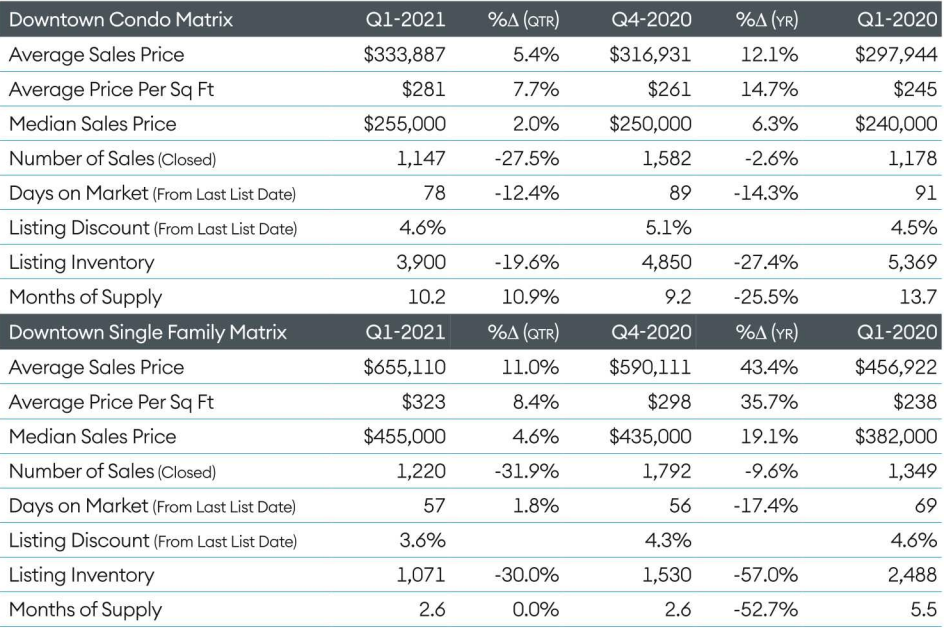
Insights
- Condo price trend indicators rose sharply to new records.
- Condo listing inventory dropped annually to a new low.
- Single family price trend indicators surged year over year.
- Single family listing inventory and month of supply fell sharply to record lows.
Palmetto Bay
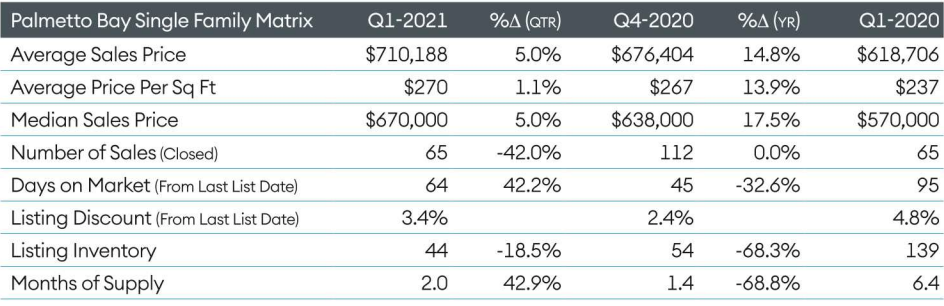
Insights
- Single family median sales price and average price per square foot rose to new records.
- Listing inventory fell year over year at the highest rate to a new low.
Pinecrest
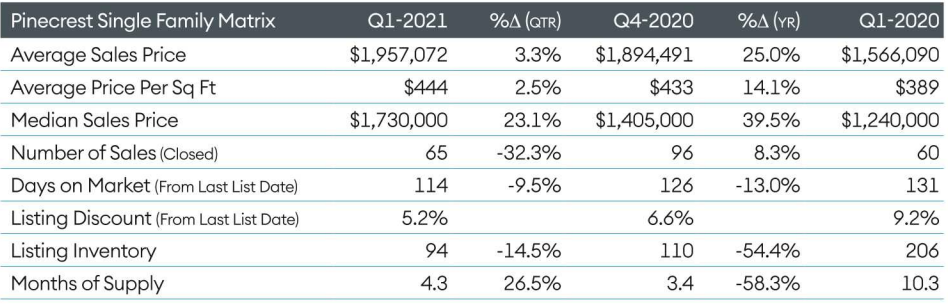
Insights
- All price trend indicators rose to new records.
- Listing inventory fell year over year at the highest rate to a new low.
South Miami
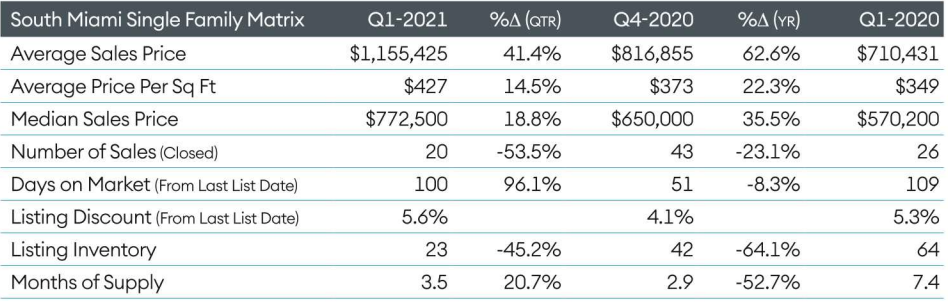
Insights
- All price trend indicators rose to new records.
- Listing inventory fell year over year at the highest rate to a new low.
Luxury
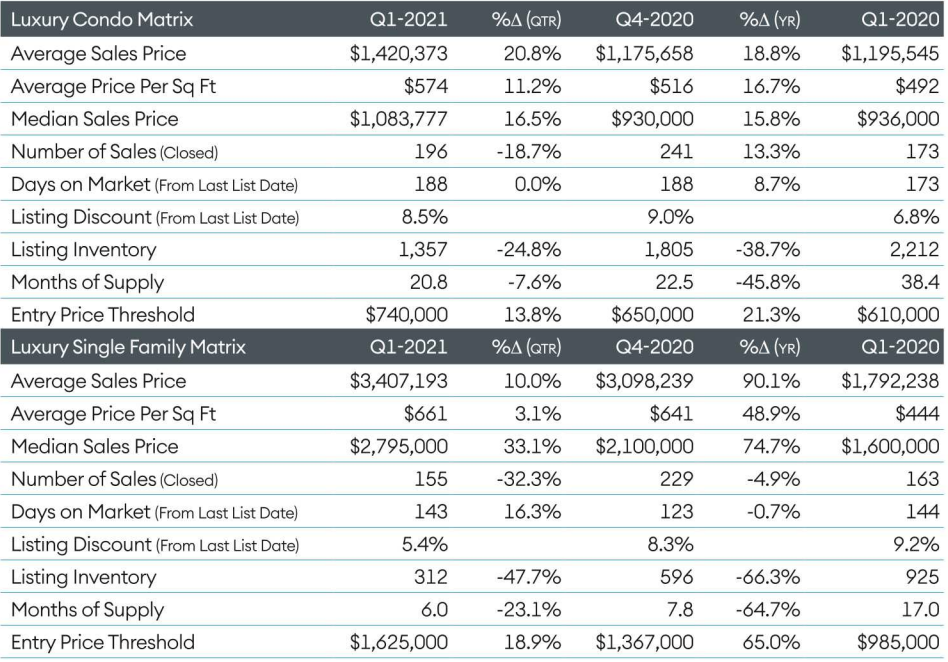
Insights
- Condo price trend indicators continued to rise as listing inventory fell annually for the third straight quarter.
- Condo listing inventory fell at the largest year over year rate in more than seven years.
- Single family price trend indicators jumped year over year for the third straight quarter to new records.
- Single family listings inventory fell by its largest rate to its lowest level.

Disclaimer
The data included in this report is issued by Douglas Elliman Real Estate in collaboration with Miller Samuel Real Estate Appraisers & Consultants. Helm Bank USA is not responsible for any of the content in the report and disclaims any responsibility for its accuracy. The report is posted for informational purposes and should not be construed as an endorsement of the report or of either company by Helm Bank USA.